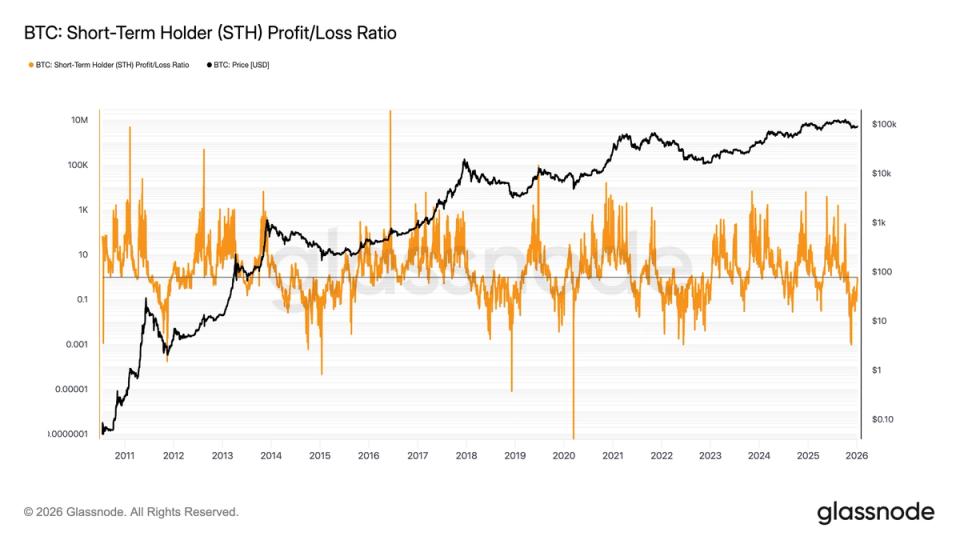
as bitcoin Plunging to nearly $80,000 in late November, the ratio between the supply of short-term holder profits and the supply of short-term holder losses fell to levels historically consistent with major or localized bear market bottoms.
On November 24, the ratio dropped to 0.013. Each previous time the ratio reached this level marked a local bottom or clear bear market low, including in 2011, 2015, 2018 and 2022, according to Glassnode data.
Glassnode defines short-term holders as investors who have held Bitcoin for less than 155 days. At the November trough, the seven-day moving average of short-term holder profit supply fell to around 30,000 BTC. In contrast, short-term holder supply losses surged to 2.45 million BTC, the highest level since the FTX crash in November 2022, when Bitcoin bottomed near $15,000.
Since the beginning of 2026, Bitcoin has risen to around $94,000, a gain of more than 7%. During this period, the supply of loss-making short-term holders has dropped to 1.9 million BTC, while the supply of profitable short-term holders has rebounded significantly to 850,000 BTC, with a ratio of approximately 0.45.
Historically, when the ratio is close to 1, it tends to expand above that ratio and continue to expand above that ratio. The price of Bitcoin tends to enter a sustained upward phase at the same time. With the ratio currently below 0.5%, the indicator suggests there is room for further significant expansion before equilibrium is reached.
As for the top, it often doesn’t occur until the ratio reaches 100.