


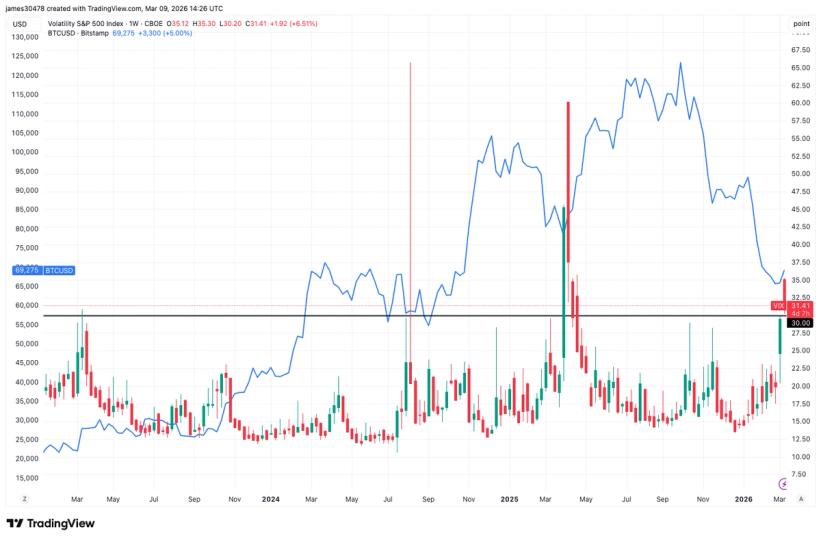
The VIX and Bitcoin often move in opposite directions, with sharp rises in the volatility index often coinciding with local bottoms in Bitcoin.
The CBOE Volatility Index (VIX) jumped to its highest level in nearly a year, rising above 35. The index measures expected volatility in the S&P 500 based on options pricing and is widely considered Wall Street’s “fear gauge.” The index jumped to its highest level in nearly a year, rising above 35. The spike points to growing panic in traditional markets.
The move comes as global markets react to soaring oil prices. WTI crude oil surged to around $120 at the open on Sunday before falling back to $100. Volatility put pressure on traditional safe-haven assets and stocks, with U.S. stocks and gold both falling.
However, Bitcoin deviated from this trend. The largest cryptocurrency has gained about 5% in the past 24 hours, trading above $69,000.
Historically, when the VIX surges, Bitcoin tends to bottom. During the tariff-driven market turmoil in April 2025, Bitcoin found support near $75,000 as the VIX surged to around 60. In August 2024, the unwinding of the yen carry trade pushed the VIX above 64, while Bitcoin fell to approximately $49,000. A similar pattern emerged during the Silicon Valley banking crisis in March 2023, when the VIX briefly rose above 30 and Bitcoin hit local lows near $20,000.
Bitcoin’s own volatility indicator suggests that the crypto market has gone through a panic phase. The Bitcoin Volmex Implied Volatility Index (BVIV), which measures expected price swings in Bitcoin options pricing, surged above 96 in early February when Bitcoin briefly fell to $60,000, its highest level since the yen carry trade turmoil in August 2024. BVIV is now back above 60.
This divergence may indicate that cryptocurrency markets are ahead of the pressures currently facing traditional finance, although the VIX approaching 30 suggests that the volatility in traditional markets may not be over yet.