


Since returning to the White House in January, President Donald Trump has reversed decades of U.S. trade policy — building a wall of tariffs around a once broadly open economy.
He has imposed double-digit tariffs on imports from nearly every country, disrupting global commerce and straining the budgets of consumers and businesses around the world. They also raised tens of billions of dollars for the U.S. Treasury.
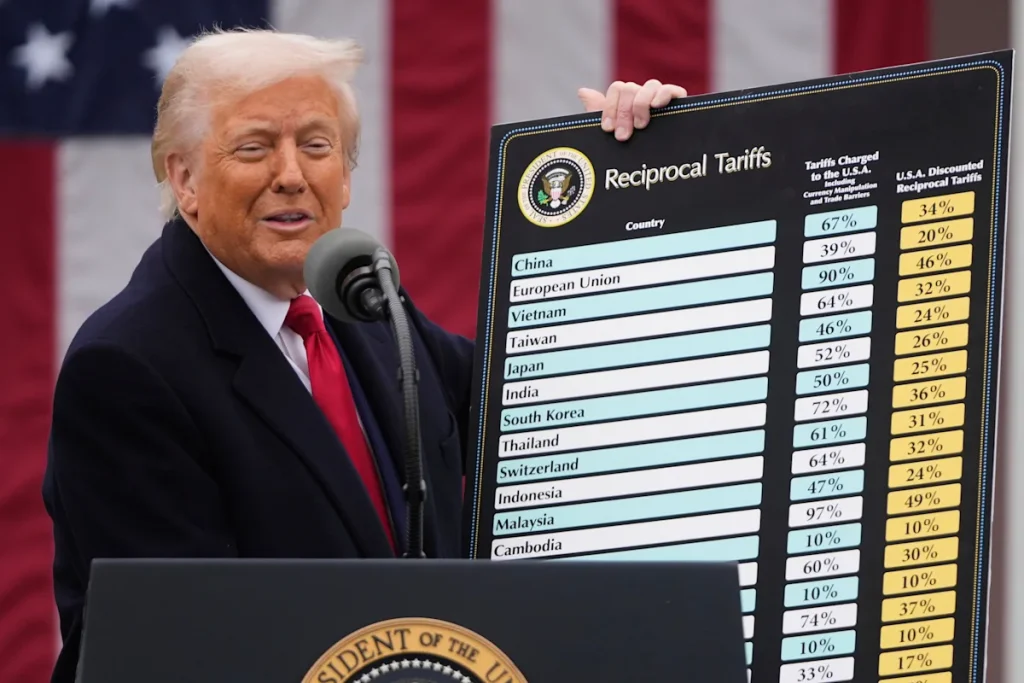
Trump argued that his steep new import taxes were necessary to recapture the wealth “stolen” from the United States. He said it would shrink the U.S.’s decades-long trade deficit and bring manufacturing back to the United States. But upending global supply chains has proven costly for households facing rising prices. The president’s erratic approach to rolling out tariffs — announcing them, then suspending or changing them, and then enacting new ones — has made 2025 one of the most volatile economic years in recent memory.
Below are four charts showing the impact of Trump’s tariffs last year.
U.S. effective tariff rate
A key figure for the overall impact of tariffs on U.S. consumers and businesses is the “effective” tariff rate — which, unlike the overall figure Trump has imposed in response to specific trade actions, provides an average based on actual U.S. imports.
U.S. effective tariff rates peaked in April in 2025, according to the Yale Budget Laboratory. But it is still well above the average level at the beginning of the year. Before consumption changes were finalized, the effective tariff rate in November was nearly 17%, seven times the January average and the highest level since 1935.
Tariff Revenues and the U.S. Trade Deficit
Among the selling points to justify his tariffs, Trump has repeatedly said they would reduce the U.S. long-term trade deficit and generate revenue for the Treasury.
Trump is undoubtedly raising money by raising tariffs. This year through November, their revenue has exceeded $236 billion, much higher than in previous years. But they still represent only a small portion of the federal government’s total revenue. And they haven’t raised enough money to justify the president’s assertion that tariff revenue could replace federal income taxes or provide Americans with unexpected dividend checks.
Meanwhile, the U.S. trade deficit has fallen significantly since the beginning of the year. The trade deficit hit a record $136.4 billion in March as consumers and businesses rushed to import foreign products before Trump imposed tariffs on them. The trade deficit narrowed to $52.8 billion in September, the latest month for which data are available. But as of January to September 2024, the deficit so far this year is still 17%.
Changes in imports from the U.S.’s largest trading partner
Trump’s 2025 tariffs hit nearly every country in the world, including America’s largest trading partners. But his policies have had the biggest impact on U.S. trade with China, once the U.S.’s largest source of imports and now third behind Canada and Mexico. According to calculations by Chad Bown of the Peterson Institute for International Economics, U.S. tariffs on Chinese imports currently reach 47.5%.
In the first three quarters of this year, the value of goods entering the United States from China fell by nearly 25%. Imports from Canada also declined. But so far this year, the value of products from Mexico, Vietnam and Taiwan has increased.
market fluctuations
For investors, the most volatile moment for stocks this year comes amid some of the most volatile moments of Trump’s tariffs.
The S&P 500, the largest index of publicly traded companies in the United States, saw its largest daily and weekly moves in April, as well as its largest monthly declines in March and its largest gains in June.
Need a refresher on how Trump’s trade actions will unfold in 2025? See schedule here.