


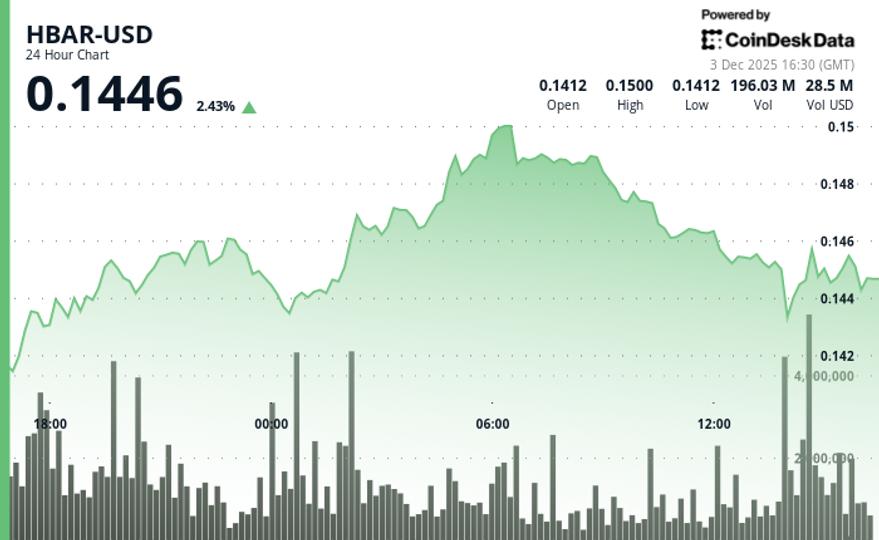
HBAR edged higher over the 24 hours, rising from $0.1425 to $0.1453 while maintaining price action within a tight ascending channel structure.
The coin is showing a stable accumulation pattern rather than speculative momentum. Volume increased 52.51% from the 7-day moving average, indicating real market participation.
The progress coincides with strength in the broader cryptocurrency market. The difference between HBAR and CD5 index is minimal, with a relative difference of only 0.25%.
Price action established a series of higher lows throughout the session. The most significant volume event occurred at 14:00 UTC when 165.32 million coins were traded, 138% above the 24-hour simple moving average.
This spike in volume was accompanied by volatility rejection near resistance near $0.1467. HBAR found solid support at $0.1427, validating the ascending trendline originating from $0.1411.
Institutional Momentum vs. Technical Resistance: What Traders Should Watch
Institutional access has expanded significantly as Canary Capital’s HBAR ETF becomes available for trading through Vanguard’s brokerage interface, while technology levels show cautious consolidation.
The timing of this development coincides with HBAR’s test of key resistance. Price action is still driven primarily by technical factors rather than direct news flow.
The state of Georgia announced that it will move its land registry to Hedera to tokenize real estate, providing fundamental support for technological advancements. It’s worth noting, however, that HBAR remains at the mercy of the broader market and will come under pressure if Bitcoin and Ethereum begin to retrace Wednesday’s gains.
Key technical level signal integration HBAR breakthrough potential
- Support/Resistance: The main support is at $0.1427 and the resistance is near $0.1467; the ascending trendline starting at $0.1411 remains intact.
- Trading volume analysis: The number of coins surged to 165.32 million (138% above the SMA) during a test of resistance, confirming continued above-average activity from institutional participation.
- Chart mode: There was a V-shaped recovery in the 60-minute time frame, breaking above $0.145; the ascending channel structure maintained a bullish bias, with a total range of $0.0081.
- Goals and risks: The near-term upside target is resistance at $0.1467 and extending to $0.148; downside risk is limited to the support at $0.1427 and the confluence of the ascending trendline.
Disclaimer: Portions of this article were generated with the help of artificial intelligence tools and reviewed by our editorial team for accuracy and adherence to our standards. For more information, see CoinDesk’s full AI policy.