


Bitcoin Again diverging from traditional risk asset complex performance, the latest divergence may be sending an important signal.
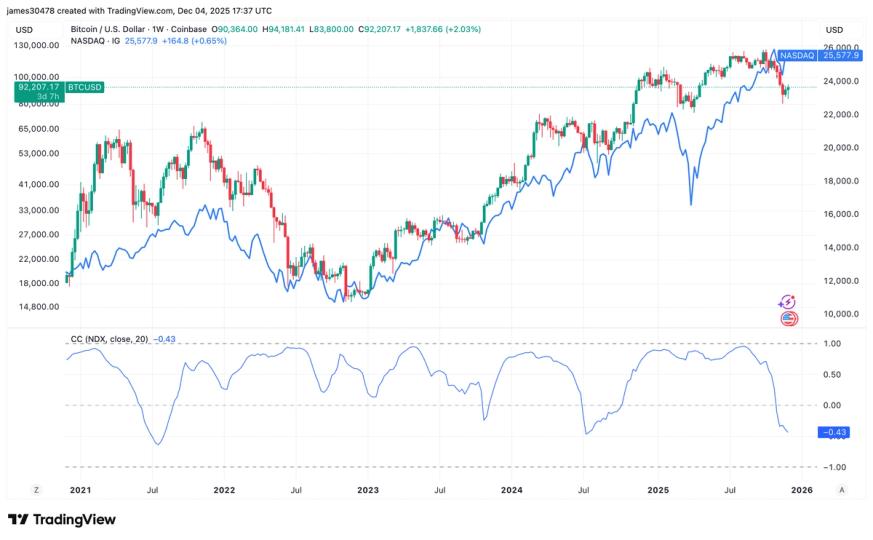
The negative correlation between Bitcoin and the Nasdaq 100 generally coincides with Bitcoin’s market bottoms, and the current setup looks similar to several turning points in the past.
This is the fourth time in the past five years that the 20-day correlation between the two assets has gone negative, currently sitting at -0.43. The pattern is also similar to the negative correlation periods seen in the summer of 2021 and August 2024, both of which coincided with meaningful lows for Bitcoin. While Bitcoin is often described as a highly leveraged beta tech asset that tends to outperform during risk-on periods and underperform during risk-off periods, the current divergence is notable.
Bitcoin is down 36% from its all-time high in October. In comparison, the Nasdaq 100’s maximum decline was only 8%, and it currently trades only 2% below its all-time high. Bitcoin has yet to recover like the broader tech sector and is currently 27% below its all-time high.
The previous instance of negative correlation occurred during the unwinding of the Japanese yen carry trade, which pushed Bitcoin down to around $49,000, a move that ultimately marked a local bottom. Prior to this, the negative correlation occurred in September 2023, when Bitcoin was trading just below $30,000, before rebounding to $40,000 by the end of the year. The first example occurred during the Chinese mining ban in May 2021, when Bitcoin fell from $60,000 to $30,000 before recovering to new highs in November 2021.
Taken together, these events suggest that the negative correlation between Bitcoin and the Nasdaq 100 often occurs near major turning points for Bitcoin. While current conditions suggest another bottom may be forming, the timing of the rebound remains uncertain.